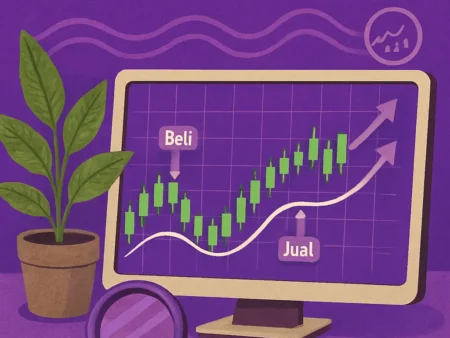
Cara menggunakan indikator MACD: Perhatikan perpotongan garis MACD dan sinyal, serta divergensi antara MACD dan harga.
Cara Menggunakan Indikator Moving Average Convergence Divergence (MACD)
-
Table of Contents
Introduction

Moving Average Convergence Divergence (MACD) is a popular technical analysis indicator used by traders to identify potential buy and sell signals in the financial markets. It is widely used in Indonesia by both novice and experienced traders to make informed trading decisions. In this article, we will explore what MACD is, how it works, and how to effectively use it in your trading strategy.
Understanding MACD
What is MACD?
MACD is a trend-following momentum indicator that shows the relationship between two moving averages of an asset’s price. It consists of three components: the MACD line, the signal line, and the histogram. The MACD line is calculated by subtracting the 26-day exponential moving average (EMA) from the 12-day EMA. The signal line is a 9-day EMA of the MACD line, and the histogram represents the difference between the MACD line and the signal line.
How does MACD work?
MACD is based on the principle that moving averages of different lengths can provide valuable information about the market’s momentum. When the MACD line crosses above the signal line, it generates a bullish signal, indicating that it may be a good time to buy. Conversely, when the MACD line crosses below the signal line, it generates a bearish signal, indicating that it may be a good time to sell.
The histogram, which represents the difference between the MACD line and the signal line, provides additional insight into the strength of the trend. Positive histogram bars indicate bullish momentum, while negative bars indicate bearish momentum. Traders often look for divergences between the price and the MACD histogram to identify potential trend reversals.
Using MACD in Your Trading Strategy
Identifying Trend Reversals
One of the primary uses of MACD is to identify trend reversals. When the MACD line crosses above the signal line, it suggests that the asset’s price may start to rise, indicating a potential buying opportunity. Conversely, when the MACD line crosses below the signal line, it suggests that the asset’s price may start to decline, indicating a potential selling opportunity.
Traders often look for confirmation from other technical indicators or chart patterns before making a trading decision based on MACD signals. For example, they may wait for a breakout above a key resistance level or a bullish reversal pattern before entering a long position.
Confirming Trend Strength
In addition to identifying trend reversals, MACD can also be used to confirm the strength of an existing trend. When the MACD line and the signal line are far apart and moving in the same direction, it indicates a strong trend. Conversely, when the MACD line and the signal line are close together or converging, it suggests a weakening trend.
Traders can use this information to adjust their trading strategy accordingly. For example, if the MACD lines are far apart and moving upward, it may be a good time to add to a long position. On the other hand, if the MACD lines are close together and moving downward, it may be a sign to consider taking profits or exiting a position.
Identifying Divergences
Divergences occur when the price of an asset and the MACD histogram move in opposite directions. This can be a powerful signal of a potential trend reversal. Bullish divergences occur when the price makes a lower low, but the MACD histogram makes a higher low. This suggests that the selling pressure is weakening, and a bullish reversal may be imminent. Conversely, bearish divergences occur when the price makes a higher high, but the MACD histogram makes a lower high, indicating that the buying pressure is weakening, and a bearish reversal may be on the horizon.
Traders should exercise caution when using divergences as a trading signal and look for confirmation from other indicators or chart patterns. False divergences can occur, leading to potential losses if not properly validated.
Conclusion
MACD is a versatile and widely used technical analysis indicator in Indonesia. It can be a valuable tool for traders to identify potential buy and sell signals, confirm trend strength, and spot trend reversals. By understanding how MACD works and incorporating it into your trading strategy, you can make more informed trading decisions and improve your chances of success in the financial markets. Remember to always use MACD in conjunction with other technical indicators and chart patterns for a comprehensive analysis of the market.

Latest News